In the automotive industry, simulation engineers don't just run analyses — they communicate results. A crash simulation generates millions of data points, but the design engineer needs to see where the B-pillar buckles, not a table of numbers. A durability analysis predicts component life, but the manager needs to see which stress concentration limits the design.
This course teaches you to create professional visualizations for computational mechanics — from stress tensor animations to deformation mappings to FEM result rendering.
Why Visualization Matters
Consider a typical day at TATA Motors' crash simulation team:
Sponsored
175+ hours of industry projects & 12 IIT faculty sessions
Master CATIA, NX, LS-DYNA, HyperMesh and more
View Full Curriculum
Morning: Run LS-DYNA simulation of NCAP side impact (4 hours compute time)
Evening: Present findings to design team: "B-pillar section needs reinforcement"
That presentation determines whether your recommendation gets implemented. A compelling visualization — showing exactly how stress propagates through the B-pillar — is worth more than a hundred spreadsheets.
Click each stage to see what visualizations are created at that step.
Types of CAE Visualizations
1. Stress Tensor Visualizations
Every structural analyst works with the Cauchy stress tensor — a 3×3 matrix that describes internal forces at a point. But understanding what $\sigma_{12}$ means physically requires visualization.
In this course, you'll create animations showing:
Sponsored
April batch closing soon — only 42 seats remaining
Join 3,000+ engineers who got placed at top companies
Reserve Your Seat
Normal stresses ($\sigma_{11}, \sigma_{22}, \sigma_{33}$) as forces perpendicular to faces
Shear stresses ($\sigma_{12}, \sigma_{23}, \sigma_{13}$) as forces parallel to faces
Traction vectors on arbitrarily oriented surfaces
Automotive Application: Spot weld stress during frontal crash. Understanding which stress components dominate helps predict weld failure modes.
2. Kinematics and Deformation
Nonlinear FEA (crash, rubber seals, forming) involves large deformations. The mathematics of kinematics — reference configuration, current configuration, deformation gradient — can be abstract. But when you see a material point moving through space, the concepts become intuitive.
You'll create animations showing:
Reference (undeformed) vs current (deformed) configuration
Material point tracking through deformation
The deformation gradient tensor $\mathbf{F}$ transforming infinitesimal elements
Automotive Application: Rubber door seal compression. When the door closes, the seal deforms significantly — up to 50% strain. Understanding this deformation is critical for sealing performance.
3. Different Stress Measures
In large deformation analysis, there are multiple stress measures:
Sponsored
70% of India's auto industry trusts Skill-Lync
For training their engineers in CAD, CAE & simulation
Learn More
Cauchy stress $\boldsymbol{\sigma}$: True stress in current configuration
1st Piola-Kirchhoff $\mathbf{P}$: Force per undeformed area
2nd Piola-Kirchhoff $\mathbf{S}$: Work-conjugate to Green strain
These aren't just mathematical curiosities — LS-DYNA, Abaqus, and NASTRAN output different measures by default. Knowing which to use (and how to convert) is essential.
4. Finite Element Discretization
The FEM approximates continuous fields with nodal values and shape functions. Visualizing this process — how infinite DOFs become finite, how mesh refinement improves accuracy — builds intuition for mesh sensitivity.
You'll create animations showing:
Shape function interpolation
Mesh convergence visualization
The effect of element order (linear vs quadratic)
🎯3,000+ Engineers Placed
Sponsored
Harshal
Fiat Chrysler
Abhishek
TATA ELXSI
Srinithin
Xitadel
Ranjith
Core Automotive
Gaurav
Automotive Company
Bino
Design Firm
Aseem
EV Company
Puneet
Automotive Company
Vishal
EV Startup
More Success Stories
Tools You'll Learn
This course covers three visualization technologies:
Matplotlib (Python)
The workhorse of scientific visualization. You'll use it for:
Mathematical animation library used by 3Blue1Brown. Perfect for:
Smooth transformations and morphing
Equation animations
Educational content with professional polish
from manim import *

class Kinematics2D(Scene):
    def construct(self):
        time = ValueTracker(0)
        body = always_redraw(lambda:
            reference.apply_function(lambda X: phi(X, time.get_value()))
        )
        self.play(time.animate.set_value(1.0))
Blender (Python)
3D rendering for photorealistic visualizations:
Import FEA mesh with deformation
Add materials, lighting, camera animation
Render high-quality videos for presentations
Indian Industry Applications
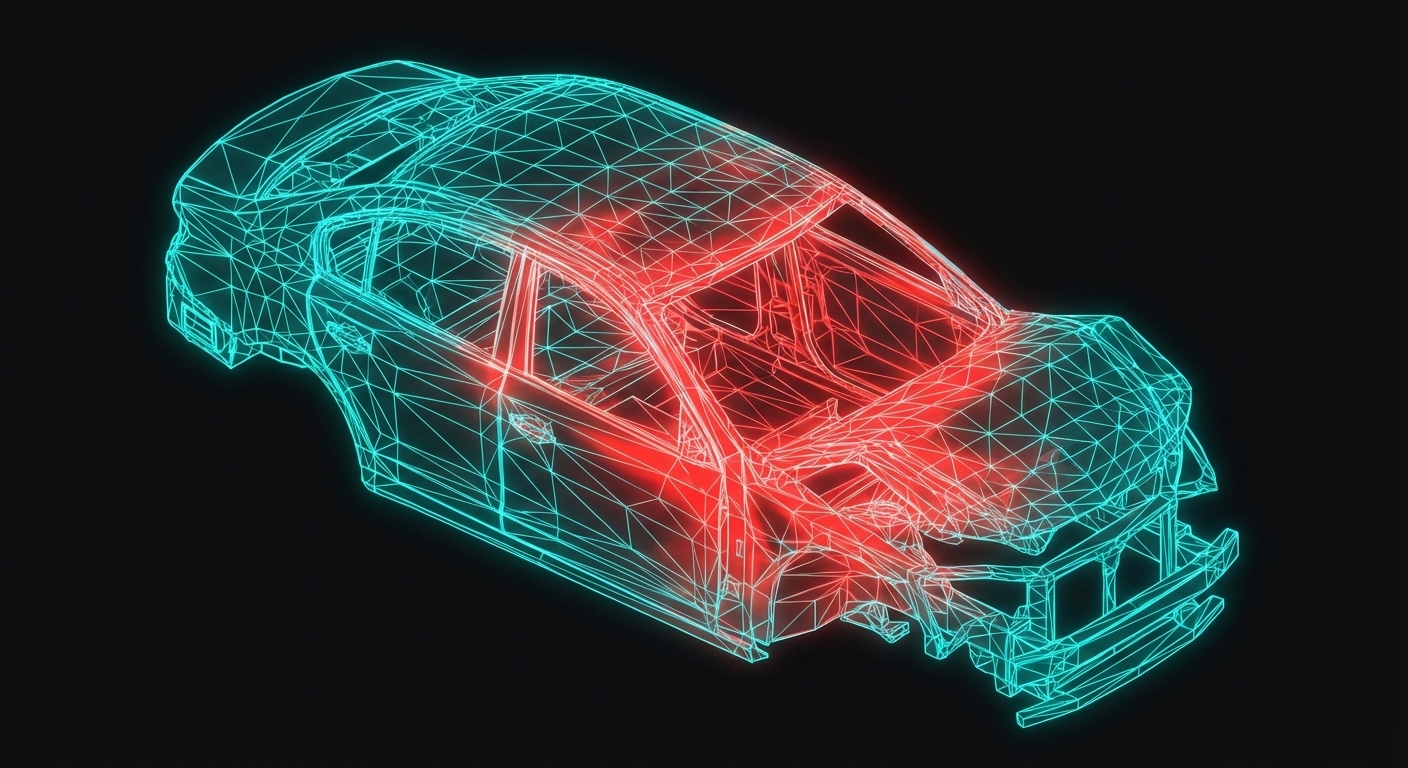
TATA Motors — Crash Visualization
TATA's safety team uses custom visualization scripts to:
Show B-pillar intrusion over time
Animate stress wave propagation
Overlay crash dummy kinematics
These visualizations helped communicate the Nexon's 5-star GNCAP performance to global media.
Mahindra — Durability Fatigue
Mahindra's CAE team visualizes fatigue hotspots on suspension components:
Cycle-by-cycle damage accumulation
Rainflow counting results
Component life predictions
Clear visualizations help convince suppliers to modify their designs.
L&T — Thermal-Structural
For pressure vessel analysis, L&T engineers create:
Transient temperature field animations
Thermal stress evolution during startup
Creep damage contours at high temperature
Course Structure
Over the next 10 lessons, you'll learn:
Lesson
Topic
Key Skill
2
Stress Tensor Components
Visualize all 6 stress components
3
Large Deformation Kinematics
Reference/current config animations
4
Deformation Gradient Tensor
F tensor field visualization
5
Different Stress Measures
Compare Cauchy, PK1, PK2
6
FEM & Shape Functions
Interactive nodal value adjustment
7
Mesh Refinement
Convergence visualization
8
Matplotlib Animations
Full tutorial with code
9
Manim Animations
Full tutorial with code
10
Blender Visualization
Full tutorial with code
Each lesson includes:
Conceptual explanation with automotive context
Python code you can run immediately
Interactive diagrams for browser-based exploration
Familiarity with FEA basics (nodes, elements, mesh)
If you haven't completed the FEA Fundamentals course, consider doing that first — it covers the mathematical foundations in detail.
Key Takeaways
Visualization is communication — your analysis is only as good as your ability to explain it
Stress tensors can be visualized as traction vectors on volume elements
Kinematics becomes intuitive when you see material points moving through deformation
Different stress measures (Cauchy, PK1, PK2) appear in different FEA software outputs
Matplotlib, Manim, and Blender cover different visualization needs
What's Next
In the next lesson, we'll dive into stress tensor components — the foundation of all structural visualization. You'll learn the mathematics of traction vectors and create your first 3D stress animation.
Career Growth
3,000+ Engineers Placed in Top Companies
Join the ranks of successful engineers at Bosch, Tata, L&T, and 500+ hiring partners.